Construction Materials Tests

Flow Test of Concrete

Flow Test

Flow testing provides essential quality control for high-workability concrete applications where traditional slump testing falls short. This comprehensive guide covers internationally recognized procedures, equipment specifications, and practical applications relevant to Kenya’s growing construction sector. Master these techniques to ensure concrete quality on your next pumped concrete, self-compacting, or heavily reinforced project—your structures’ integrity depends on it.

The flow test determines workability for flowing concrete with slumps exceeding 175mm—a critical measurement that separates successful high-performance construction from structural failures. You're about to discover why this seemingly simple test holds the key to quality control in modern concrete placement, especially when working with self-compacting mixes, pumped concrete, or heavily reinforced elements where traditional slump testing falls short.

What is the Flow Test of Concrete?

Flow test measures how concrete spreads horizontally after being jolted on a specialized table. Unlike the conventional concrete slump test, which measures vertical subsidence, the flow test evaluates concrete that’s too fluid to maintain its shape after mold removal.

Think of it this way: when your concrete behaves more like thick honey than moldable clay, you need a different assessment tool. The flow test fills that gap by quantifying the spreading diameter of highly workable concrete after controlled jolting. This measurement, expressed either as millimeters of spread or as a percentage increase from the original mold diameter, tells you whether your mix will flow through tight spaces, fill complex formwork, or pump efficiently to elevated heights.

The test originated in Germany in 1933 and quickly became the go-to method for evaluating high-workability concrete mixes. British Standard BS 1881:105:1984 later codified the procedure, establishing the technical framework still used across Kenya’s construction industry today. When you’re working on projects governed by National Construction Authority regulations, understanding this test becomes non-negotiable.

How Does Flow Test Differ from Slump Test?

The distinction matters more than you might think. Slump test works brilliantly for conventional concrete with medium workability—think typical building slabs or columns. But introduce superplasticizers, increase water content, or design a self-compacting mix, and the slump cone reveals nothing useful. The concrete simply collapses into a pancake shape, giving you what’s called a “collapse slump.”

Enter the flow test. This method embraces that fluid nature. Rather than fighting it, you measure it systematically. A.M. Neville, honorary member of the American Concrete Institute, emphasized that slump and flow tests measure entirely different physical phenomena. No mathematical relationship connects the two because they evaluate distinct aspects of concrete behavior.

Here’s what sets them apart:

Slump test: Measures vertical subsidence immediately after removing the cone. Best for concrete with 50-175mm slump range. Quick, simple, requires minimal equipment. Fails to differentiate between highly workable mixes.

Flow test: Measures horizontal spread after jolting. Designed for concrete with slumps exceeding 175mm or flow ranges of 340-600mm. Requires specialized table apparatus. Provides precise differentiation between flowing concrete types.

When you’re dealing with projects requiring on-site concrete mixing in Kenya, knowing which test to deploy saves both time and materials.

Why High-Workability Concrete Needs Special Testing

High-workability concrete doesn’t behave like its conventional cousins. You’re working with a material engineered to flow through maze-like reinforcement, self-level across large surfaces, or pump vertically through dozens of meters without segregation. This behavior demands precise quality control.

Consider cast-in-situ piles sunk 30 meters into Nairobi’s challenging soil conditions. You cannot vibrate concrete at that depth. The mix must flow, fill every void, and encapsulate reinforcement without human intervention. That’s where flow testing proves its worth—it predicts this self-leveling behavior before you commit thousands of cubic meters to the ground.

Self-compacting concrete (SCC) represents the pinnacle of high-workability design. These mixes flow like water yet maintain cohesion that prevents aggregate separation. Testing laboratories certified under Kenya’s materials testing requirements rely on flow tests to verify SCC performance before it leaves the batch plant.

The consequences of inadequate testing? Honeycombing in structural elements. Voids around reinforcement leading to accelerated corrosion. Segregation causing strength variations across a single pour. Each of these failures traces back to improper workability assessment.

Applications Demanding Flow Test Verification

Pumped concrete operations across Kenya’s growing skyline depend on flow testing. When ready-mix concrete suppliers promise delivery to the 40th floor of a Nairobi high-rise, they’re relying on flow test data to ensure that mix maintains pumpability throughout the journey.

Confined structures present another challenge. Underground parking structures, elevator shafts, and foundation types for different Kenyan soils often feature congested reinforcement that makes vibration impractical. The concrete must flow around every bar, filling spaces measured in millimeters.

Long-distance pumping adds complexity. Concrete traveling through hundreds of meters of pipeline faces friction, time delays, and temperature variations. Flow testing at multiple points—at batching, after pumping, and at placement—ensures consistency throughout the operation.

Understanding Flow Test Standards and Specifications

BS 1881:105:1984 established the foundational protocol for flow table testing. This British Standard specifies a 700mm square flow table with hinged construction allowing 40mm drop height. Kenya’s engineering community widely adopts this standard alongside Eurocode design approaches.

Indian Standard IS 1199-1959 offers a slightly different approach, using a 250mm base diameter cone and measuring flow in six directions. Many Asian-manufactured testing equipment in Kenya follows IS specifications, making familiarity with both standards valuable.

American standards (ASTM C124) employ a circular table rather than square, measuring 250mm in diameter. The procedure differs slightly—25 tamps per layer versus 10, and different timing requirements. When working with international consultants or reviewing imported equipment specifications, these variations matter.

BS EN 12350 represents the current European harmonized standard, increasingly referenced in BS EN 206 concrete specifications. As Kenya’s construction sector globalizes, understanding EN standards becomes crucial for large infrastructure projects.

The National Construction Authority doesn’t mandate specific workability test methods, instead requiring compliance with internationally recognized standards. This flexibility allows contractors to select appropriate testing methods based on concrete type, project requirements, and available equipment.

Flow Test Equipment: A Detailed Breakdown

Flow Test Apparatus

The flow table forms the test’s foundation—literally. You’re looking at a 700mm x 700mm steel-topped board weighing approximately 16kg. One edge connects to a base via hinges, allowing the table to lift and drop freely. The dropping mechanism must allow exactly 40mm of vertical movement before striking the base plate.

Quality tables feature measurement markings etched into the steel surface. These concentric circles or gridlines help position the cone centrally and facilitate quick diameter measurements. The table surface must be smooth, level, and free from dents or deformations that could affect concrete flow patterns.

Truncated cone mould specifications vary by standard. BS requirements call for 200mm base diameter, 130mm top diameter, and 200mm height. IS standards specify 250mm base, 170mm top, 120mm height. Both designs feature handles for easy lifting and must be manufactured from rigid, non-absorbent metal.

The cone’s internal surface finish matters more than most technicians realize. Rough surfaces create friction that retards flow, while excessively smooth surfaces might not provide enough resistance for proper mold filling. Look for machined steel or aluminum cones meeting your chosen standard’s specifications.

Tamping rod dimensions follow strict guidelines: 16mm diameter, 600mm length, with hemispherical or rounded ends. The round ends prevent concrete damage during compaction. Some rods feature measurement markings to help gauge layer heights during filling. Steel construction ensures durability, though the rod must remain straight—bent tamping rods invalidate test results.

Measuring equipment includes a steel ruler or measuring tape capable of reading to the nearest 5mm. Digital calipers provide more precise measurements but aren’t necessary for standard compliance. Some advanced setups employ overhead digital imaging systems that calculate spread diameter automatically—useful for high-volume testing operations at major batch plants.

Supporting equipment includes a trowel for striking off excess concrete, clean cloths for table preparation, and sample containers meeting material testing requirements. A stopwatch or timer ensures the 15-jolt sequence completes within the prescribed timeframe.

Step-by-Step Flow Test Procedure

Proper execution determines result reliability. Skip a step or rush the process, and you’re measuring nothing meaningful. Here’s how professionals conduct flow testing:

Step 1: Surface preparation. Wipe both the flow table and cone interior with a dampened cloth. The surfaces should be moist but not dripping. Water films cause concrete to slip excessively; dry surfaces absorb moisture from the sample. This balance affects flow measurements significantly.

Step 2: Sample collection. Obtain representative concrete from the middle of your batch, not from the edges where segregation concentrates heavier aggregates. Mix the sample thoroughly with a shovel, turning it at least three times before testing. Time elapsed since mixing affects results—test within 5 minutes of sampling for consistency.

Step 3: Cone positioning. Place the mould centrally on the flow table with the narrow end upward. If your table features alignment marks, use them. An off-center position introduces measurement errors. Plant your feet firmly on the table base plates (most designs include footplates) to prevent movement during filling.

Step 4: First layer filling. Pour fresh concrete to approximately half the cone’s depth. “Approximately” doesn’t mean careless—aim for consistent layer thickness. Overfilling the first layer reduces the second layer’s volume, affecting compaction uniformity.

Step 5: First layer compaction. Tamp the first layer 10 times with the tamping rod. Distribute strokes uniformly across the layer’s area, penetrating to the cone bottom without striking it forcefully. Each tamp should compact the concrete without creating voids. Think rhythmic, consistent strokes rather than aggressive jabbing.

Step 6: Second layer filling and tamping. Add concrete until slightly overfilling the cone. Tamp this second layer 10 times, ensuring strokes penetrate into the first layer by approximately 25mm. This interlayer penetration bonds the layers, preventing planes of weakness that affect flow behavior.

Step 7: Leveling. Roll the tamping rod across the cone’s top edge to strike off excess concrete. The finished surface should align exactly with the cone’s rim—not concave, not convex, but perfectly level. Use the trowel to smooth minor imperfections.

Step 8: Cleanup and preparation. Hold the cone firmly while cleaning excess concrete from the table surface around the mould. Any material left on the table interferes with flow patterns. Clean, dry surfaces around the cone matter as much as the sample itself.

Step 9: Mould removal. Lift the cone vertically with steady, uniform motion. No twisting, no tilting, no lateral movement. Complete the lift within 5-10 seconds. The concrete should stand independently—if it slumps immediately, your mix might be too fluid even for flow testing.

Step 10: Jolting and measurement. Lift one edge of the flow table to its full 40mm height and allow it to drop freely. The table must strike the base plate squarely, producing a sharp impact. Complete 15 drops at a rate of one per second—about 6 seconds total. After the final jolt, measure the concrete’s spread diameter in two perpendicular directions parallel to the table edges. Average these measurements for your flow value.

Record the ambient temperature, time since mixing, and any observations about the concrete’s appearance. Note segregation signs, excessive bleeding, or unusual behavior. These qualitative observations supplement quantitative measurements, painting a complete picture of concrete quality.

Order Construction Materials From Us Today

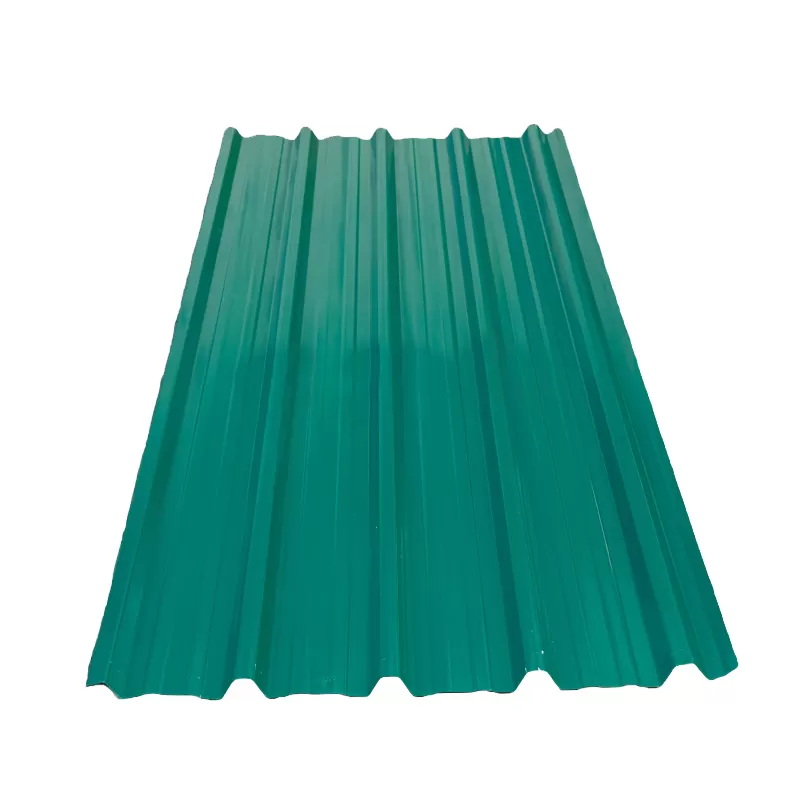
Box Profile (Glossy, Gauge 28)

KSh 650.00
Our Box Profile iron sheets are crafted for superior durability and exceptional weather resistance, making them the ideal choice for long-lasting roofing solutions across Kenya. To make your project even more convenient, we offer free delivery across Kenya when one orders 40 pieces and above. Trust us for reliable products and dependable service for all your building needs.

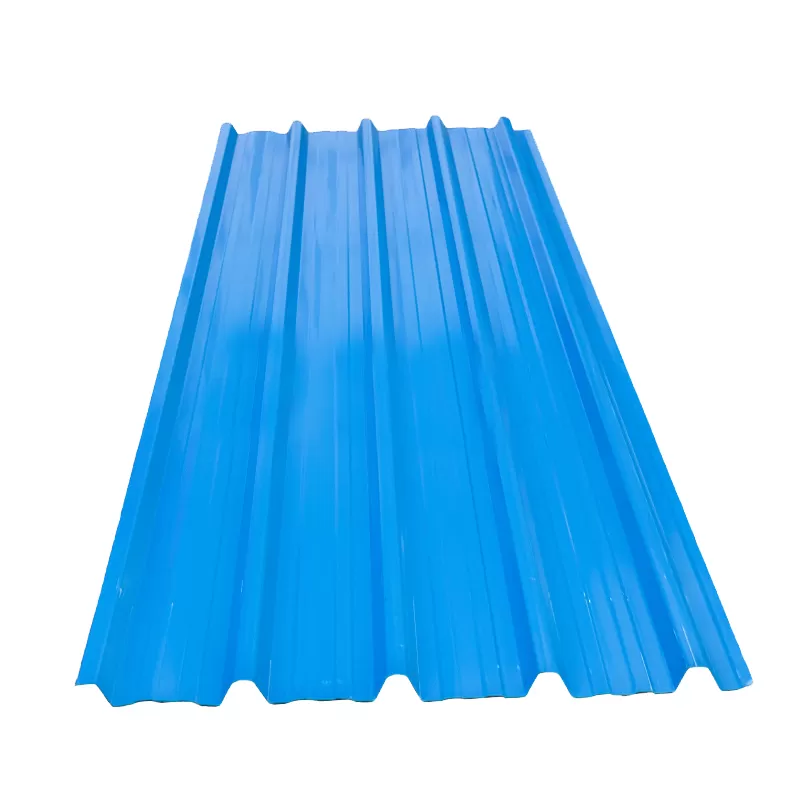
Box Profile (Glossy)

KSh 470.00
Our Box Profile iron sheets are crafted for superior durability and exceptional weather resistance, making them the ideal choice for long-lasting roofing solutions across Kenya. To make your project even more convenient, we offer free delivery across Kenya when one orders 40 pieces and above. Trust us for reliable products and dependable service for all your building needs.

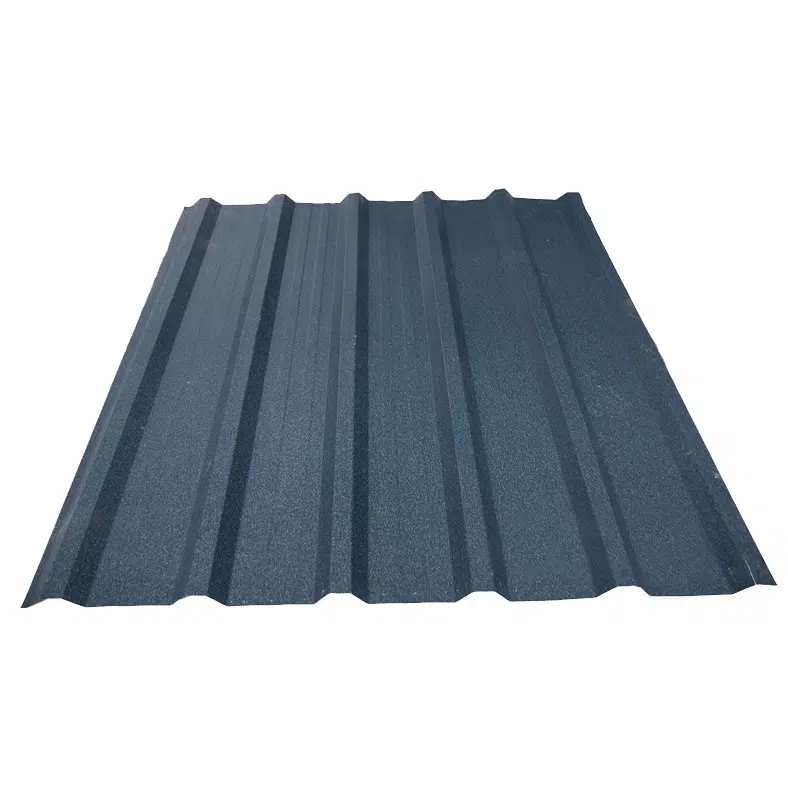
Box Profile (Matte, Gauge 28)

KSh 680.00
Our Box Profile iron sheets are crafted for superior durability and exceptional weather resistance, making them the ideal choice for long-lasting roofing solutions across Kenya. To make your project even more convenient, we offer free delivery across Kenya when one orders 40 pieces and above. Trust us for reliable products and dependable service for all your building needs.

Box Profile (Matte)

KSh 530.00
Our Box Profile iron sheets are crafted for superior durability and exceptional weather resistance, making them the ideal choice for long-lasting roofing solutions across Kenya. To make your project even more convenient, we offer free delivery across Kenya when one orders 40 pieces and above. Trust us for reliable products and dependable service for all your building needs.

Corrugated Iron Sheet (Gauge 30)

KSh 470.00
Our corrugated iron sheets are crafted for superior durability and exceptional weather resistance, making them the ideal choice for long-lasting roofing solutions across Kenya. To make your project even more convenient, we offer free delivery across Kenya when one orders 40 pieces and above. Each high-quality sheet provides excellent value for money, ensuring your structure is protected for years to come. Trust us for reliable products and dependable service for all your building needs.

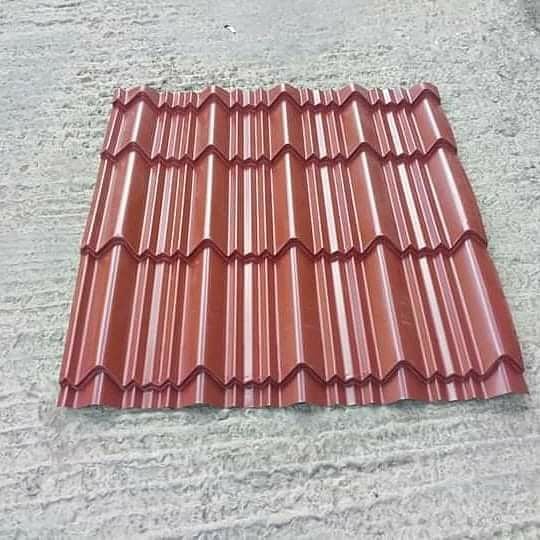
Elegantile (Glossy, Gauge 28)

KSh 670.00
Our Elegant Tile  profile are crafted for superior durability and exceptional weather resistance, making them the ideal choice for long-lasting roofing solutions across Kenya. To make your project even more convenient, we offer free delivery across Kenya when one orders 40 pieces and above. Trust us for reliable products and dependable service for all your building needs.

Elegantile (Glossy, Gauge 30)

KSh 550.00
Our Elegant Tile  profile are crafted for superior durability and exceptional weather resistance, making them the ideal choice for long-lasting roofing solutions across Kenya. To make your project even more convenient, we offer free delivery across Kenya when one orders 40 pieces and above. Trust us for reliable products and dependable service for all your building needs.

Elegantile (Matte, Gauge 28)

KSh 680.00
Our Elegant Tile  profile with matte texture are crafted for superior durability and exceptional weather resistance, making them the ideal choice for long-lasting roofing solutions across Kenya. To make your project even more convenient, we offer free delivery across Kenya when one orders 40 pieces and above. Trust us for reliable products and dependable service for all your building needs.

Elegantile (Matte, Gauge 30)

KSh 580.00
Our Elegant Tile  profile with matte texture are crafted for superior durability and exceptional weather resistance, making them the ideal choice for long-lasting roofing solutions across Kenya. To make your project even more convenient, we offer free delivery across Kenya when one orders 40 pieces and above. Trust us for reliable products and dependable service for all your building needs.

Versatile (Glossy, Gauge 28)

KSh 670.00
Our versatile iron sheets are crafted for superior durability and exceptional weather resistance, making them the ideal choice for long-lasting roofing solutions across Kenya. To make your project even more convenient, we offer free delivery across Kenya when one orders 40 pieces and above. Trust us for reliable products and dependable service for all your building needs.

Versatile (Glossy, Gauge 30)

KSh 550.00
Our versatile iron sheets are crafted for superior durability and exceptional weather resistance, making them the ideal choice for long-lasting roofing solutions across Kenya. To make your project even more convenient, we offer free delivery across Kenya when one orders 40 pieces and above. Trust us for reliable products and dependable service for all your building needs.

Versatile (Matte, Gauge 28)

KSh 680.00
Our versatile iron sheets are crafted for superior durability and exceptional weather resistance, making them the ideal choice for long-lasting roofing solutions across Kenya. To make your project even more convenient, we offer free delivery across Kenya when one orders 40 pieces and above. Trust us for reliable products and dependable service for all your building needs.

Calculating and Interpreting Flow Values

Flow calculation follows a straightforward formula. For IS standards using a 250mm base cone:

Flow (%) = [(Average spread diameter – 250) / 250] × 100

A concrete spreading to 400mm yields: [(400-250)/250] × 100 = 60% flow.

BS standards report flow directly in millimeters rather than percentages. A spread of 500mm means flow = 500mm. This approach simplifies communication and avoids calculation errors.

Acceptable ranges depend on application and standard. IS specifications consider 0-150% acceptable, though most practical applications fall between 20-80%. Concrete showing less than 20% flow might lack sufficient workability for challenging placements. Flow exceeding 100% suggests potential segregation risk requiring admixture adjustment.

BS EN 12350 specifies target ranges based on consistency classes. F1 class: 340mm minimum. F2 class: 350-410mm. F3 class: 420-480mm. F4 class: 490-550mm. F5 class: 560-620mm. F6 class: ≥630mm. Specifying the appropriate class ensures your concrete arrives with the exact workability needed.

What do these numbers actually tell you? Higher flow indicates greater fluidity—concrete that spreads easily, pumps well, and fills formwork rapidly. Lower flow suggests stiffer consistency requiring more compaction effort but potentially offering better segregation resistance.

The relationship between flow and concrete grade costs deserves attention. Higher flow typically requires more cement, specialized admixtures, or carefully graded aggregates—all factors increasing per-cubic-meter pricing.

Related Questions:

Is flow test suitable for all concrete types? No. Flow test specifically targets high-workability concrete with collapse slump behavior. Standard workability mixes (50-100mm slump) perform better in conventional slump tests. Very stiff mixes requiring compaction factor or Vebe testing won’t spread adequately on a flow table.

Can flow test predict pumping performance? Yes, within limits. Concrete demonstrating 400-600mm flow generally pumps well through standard delivery systems. However, flow testing measures static spread under controlled conditions. Actual pumping involves dynamic friction, pressure variations, and time-dependent rheology changes that flow tests don’t fully capture.

How does aggregate size affect flow test results? Maximum aggregate size should not exceed 38mm for reliable flow testing. Larger aggregates interfere with cone filling, create measurement inconsistencies, and don’t represent typical high-workability concrete specifications. When working with allowable material wastage, aggregate grading becomes crucial for maintaining consistent flow.

What’s the relationship between flow and strength? No direct correlation exists. High flow indicates workability, not strength. However, achieving high flow while maintaining strength requires careful attention to water-cement ratio, admixture selection, and cement content. Many portland cement types in Kenya perform differently in high-flow applications.

Real-World Applications of Flow Test in Kenya

Cast-in-situ pile construction across Kenya’s urban centers relies heavily on flow testing. When you’re drilling 25-meter-deep foundations for Nairobi’s tallest buildings, traditional vibration becomes impossible. The concrete must possess sufficient fluidity to travel down tremie pipes, displace bentonite slurry, and fill irregular borehole geometries—all without segregating.

Testing laboratories verify flow values between 500-600mm for pile applications. This ensures the mix exhibits self-leveling properties while maintaining cohesion. Engineers specify concrete classes C30 or higher for pile work, combining high strength requirements with exceptional workability. The balance demands precise admixture dosing and careful aggregate selection.

Pumped Concrete Operations in High-Rise Construction

Vertical concrete placement dominates Kenya’s construction landscape. Projects stretching skyward in Nairobi, Mombasa, and Kisumu demand reliable pumping performance. Ready-mix concrete suppliers conduct flow tests before dispatch and again at discharge points to verify consistency throughout the pumping process.

Pump operators target flow ranges of 450-550mm for typical high-rise work. Lower values risk pipeline blockages; higher values invite segregation and bleeding. The sweet spot varies with pumping distance, vertical lift, pipeline diameter, and ambient temperature. Summer heat in Mombasa’s coastal climate requires different specifications than Nairobi’s cooler highlands.

BASF Kenya’s MasterMatrix self-compacting concrete admixtures have revolutionized pumped concrete in Kenya. These polycarboxylate-based superplasticizers maintain workability for 90-120 minutes—sufficient for most urban delivery scenarios. Sika’s ViscoCrete line offers comparable performance, dominating Kenya’s high-performance concrete market for over a decade.

The economic impact matters. Pumped concrete eliminates costly crane operations, reduces labor requirements, and accelerates construction schedules. A 30-story building poured conventionally might require 18 months; pumped concrete with proper flow characteristics can cut that to 12 months. Time savings translate directly to reduced labour rates and earlier project returns.

Self-Compacting Concrete in Specialized Applications

SCC represents the pinnacle of flow test relevance. These mixes eliminate vibration entirely, flowing through congested reinforcement like water yet maintaining aggregate suspension. Flow testing alone doesn’t adequately characterize SCC—engineers supplement with L-box tests, J-ring tests, and V-funnel assessments—but the flow table remains the primary field verification tool.

Kenya’s precast concrete sector embraces SCC for complex architectural elements. Kingdom Precast Solutions in Nairobi manufactures decorative panels, architectural facades, and structural components using SCC. The material fills intricate molds completely, capturing fine details impossible with conventional concrete. Surface finish quality eliminates expensive remedial work while accelerating production cycles.

Infrastructure projects benefit equally. The Nairobi Expressway incorporated SCC in critical structural elements where reinforcement congestion prevented adequate vibration. Underground rail construction—planned for Kenya’s future transit systems—will rely heavily on SCC for tunnel lining segments, station boxes, and complex junction structures.

Environmental considerations add another dimension. SCC reduces construction site noise by eliminating vibrators—crucial for urban projects near hospitals, schools, or residential areas. Night-shift concrete placement becomes feasible when noise ordinances would otherwise prevent work. Reduced labor requirements lower the project’s carbon footprint while improving worker safety.

Flow Test vs. Slump Flow Test: Understanding the Differences

Slump flow testing emerged as a simplified alternative to flow table testing. Rather than lifting and dropping a hinged table 15 times, you simply remove the slump cone and measure the resulting spread. It’s faster, requires no specialized apparatus, and works on any reasonably flat surface.

The procedure mirrors conventional slump testing until cone removal. After lifting the mould vertically, measure the concrete’s spread diameter in two perpendicular directions. The average becomes your slump flow value, typically ranging from 450mm to 800mm for highly workable mixes. The entire test takes perhaps 3 minutes versus 5-7 minutes for flow table testing.

Japanese standards JIS A 1150 formalized slump flow testing decades ago. The method gained traction across Asia before spreading globally. Kenya’s construction sector increasingly adopts slump flow testing for SCC verification, particularly on smaller projects where flow table apparatus isn’t cost-justified.

Research demonstrates good correlation between flow table and slump flow results. A 2019 study in the Journal of Construction and Building Materials found R² values exceeding 0.92 when comparing the two methods across 47 different concrete mixes. The relationship holds strongest for mixes with 20-40mm maximum aggregate size and moderate viscosity.

Practical advantages favor slump flow testing in many scenarios. Field crews appreciate the simpler procedure and lighter equipment requirements. Quality control on remote project sites—road construction in rural Kenya, bridge work in challenging terrain—benefits from slump flow’s portability. You need only a slump cone, measuring tape, and level surface.

But flow table testing offers distinct benefits. The jolting action provides better segregation assessment. Watching concrete spread after repeated impacts reveals internal cohesion that static slump flow testing masks. Bleeding becomes immediately visible. Aggregate distribution patterns emerge clearly. For critical applications justifying thorough investigation, flow table testing delivers richer information.

Specialized Workability Tests for Different Concrete Types

L-box testing evaluates passing ability—concrete’s capacity to flow through tight reinforcement without blocking. The apparatus resembles a horizontal L-shaped channel with a gate separating a vertical section (filled with concrete) from a horizontal section (containing steel reinforcement bars). Opening the gate allows concrete to flow through the rebar grid. The height difference between concrete in the vertical and horizontal sections indicates passing ability.

Acceptable L-box ratios (h2/h1) exceed 0.80 for most SCC applications. Values below 0.75 suggest inadequate passing ability—the mix will struggle in congested reinforcement. When designing concrete for heavily reinforced high-rise elements, L-box testing supplements flow measurements to ensure complete formwork filling.

V-funnel testing measures viscosity and flow time. A V-shaped funnel holds approximately 12 liters of concrete. Opening the bottom gate allows concrete to flow through a restricted orifice. Recording the time required for complete discharge characterizes the mix’s viscosity. Typical V-funnel times range from 6-12 seconds for SCC. Times exceeding 15 seconds indicate excessive viscosity; times below 5 seconds suggest potential segregation.

J-ring testing modifies slump flow testing by placing a reinforcement ring around the slump cone. The concrete must flow through the ring’s bars while spreading horizontally. Comparing J-ring spread to unobstructed slump flow spread reveals the mix’s sensitivity to reinforcement obstruction. Differences exceeding 50mm signal potential placement problems in heavily reinforced structures.

Compaction factor testing targets low-to-medium workability concrete—the opposite end of the spectrum from flow testing. The apparatus features two conical hoppers and a cylinder. Concrete’s degree of compaction under free fall indicates workability. The method suits stiff mixes for precast work, paving applications, or roller-compacted concrete where flow tests prove useless.

Understanding which test suits your application prevents costly mistakes. Specifying flow testing for stiff pavement concrete wastes time and provides meaningless data. Applying slump testing to SCC yields only “collapse slump” designations lacking quantitative value. Matching test method to concrete type ensures relevant quality control data.

Factors Affecting Flow Test Results

Water-cement ratio governs flow more powerfully than any other variable. Increasing W/C from 0.45 to 0.55 might boost flow from 400mm to 550mm—but at the cost of strength, durability, and segregation resistance. The challenge lies in achieving high flow without compromising mechanical properties. This drives admixture technology forward.

Modern polycarboxylate ether (PCE) superplasticizers available from suppliers like Sika Kenya and BASF’s Master Builders Solutions achieve remarkable results. These third-generation admixtures disperse cement particles through steric hindrance rather than electrostatic repulsion. The mechanism allows water reduction up to 40% while maintaining or enhancing workability. You get flowing concrete with W/C ratios of 0.35—unthinkable with conventional plasticizers.

Dosage rates matter enormously. Sika ViscoCrete-10, widely used across Kenya’s construction industry, typically requires 0.6-1.2% by weight of cement. Underdosing leaves concrete insufficiently workable. Overdosing risks excessive retardation, segregation, or both. Concrete water-reducing agents demand precise batching equipment and skilled operators who understand admixture chemistry.

Aggregate Properties and Grading

Aggregate shape, texture, and grading profoundly influence flow characteristics. Angular, rough-textured crushed aggregates require more paste volume to achieve given flow values compared to rounded river gravels. Kenya’s local building materials vary dramatically by region—coastal coral aggregates behave differently from volcanic stones from Mount Kenya’s quarries.

Optimizing grading through sieve analysis reduces void content, lowering paste demands for target flow values. Well-graded aggregates following Fuller’s curve or modified Bolomey distributions minimize interparticle friction. This translates to better flow with less cement—reducing costs while improving sustainability.

Maximum aggregate size limits apply. Flow testing standards typically restrict aggregates to 38mm maximum for BS procedures, 25mm for IS methods. Larger aggregates interfere with cone filling, create measurement inconsistencies, and don’t represent typical high-workability specifications. When projects specify larger aggregates, alternative workability assessment becomes necessary.

Aggregate moisture content creates headaches for batch plant operators. Saturated-surface-dry (SSD) aggregate calculations assume one moisture state, but stockpiles rarely cooperate. Excess surface moisture increases actual W/C ratios, boosting flow beyond specifications while compromising strength. Deficient moisture robs water from the paste, reducing workability. Accurate moisture monitoring systems prevent these issues.

Temperature and Time Dependencies

Ambient temperature dramatically affects concrete rheology and, consequently, flow test results. Hot weather accelerates cement hydration, increasing viscosity and reducing slump retention. Concrete mixed at 35°C in Mombasa’s summer heat might lose 100mm of flow within 30 minutes—unacceptable for projects requiring extended transport times.

Cold weather presents opposite challenges. Low temperatures slow hydration, extending workability retention but delaying strength development. Winter construction in Kenya’s highlands demands different mix designs than coastal projects. Some contractors add accelerating admixtures to compensate for temperature effects, complicating quality control protocols.

Time since mixing affects all fresh concrete properties. Cement hydration consumes water continuously, gradually stiffening the mix. Superplasticizers provide temporary relief, maintaining dispersion for 60-120 minutes depending on chemistry and dosage. Beyond that window, flow drops precipitously. Specifying maximum time limits between batching and placement protects quality.

Testing protocols must account for timing. Conducting flow tests immediately after mixing provides one data point; retesting 60 and 90 minutes later reveals workability retention. Projects with long transport distances—common in Kenya’s sprawling urban developments—require concrete maintaining adequate flow throughout the delivery cycle. Retarding admixtures extend the window but demand careful dosing to avoid excessive set delays.

Common Flow Test Problems and Solutions

Segregation manifests in several ways during flow testing. Coarse aggregate concentrating at the spread’s center indicates inadequate paste volume or excessive fluidity. A halo of mortar surrounding aggregate piles suggests the mix lacks cohesion. These visual cues warn of concrete that will segregate during placement, creating weak zones and honeycombing.

Solutions involve adjusting mix design fundamentals. Increasing paste volume—through additional cement or supplementary cementitious materials like fly ash or ground granulated blast furnace slag—improves cohesion. Incorporating viscosity-modifying admixtures (VMAs) enhances stability without significantly affecting flow. Reducing water content while maintaining flow through superplasticizer adjustment often proves most effective.

Excessive Bleeding and Surface Defects

Bleeding occurs when mix water rises to the surface faster than evaporation or absorption can dissipate it. The resulting water layer dilutes surface paste, creating weak, porous surface zones prone to dusting and scaling. Flow testing reveals bleeding through visible water films at the concrete’s leading edge as it spreads.

Addressing bleeding requires multiple interventions. Reducing W/C ratios provides the most direct solution. Incorporating supplementary cementitious materials increases water demand and reduces bleed water. Optimizing aggregate grading minimizes void spaces that channel bleed water upward. Using specialized shrinkage-reducing admixtures can help, though they add cost.

Surface finish quality matters tremendously for architectural concrete. Formwork faces exposed to view demand defect-free surfaces. Excessive flow can cause surface segregation, leaving exposed aggregate or honeycombing. Insufficient flow prevents complete formwork filling. The narrow acceptable range demands precise control through repeated flow testing and mix adjustments.

Inconsistent Results and Calibration Issues

Test variability frustrates quality control efforts. The same concrete tested by different technicians sometimes yields different flow values. Operator technique, equipment condition, and environmental factors all contribute. Standardizing procedures through training and certification reduces human error.

Equipment calibration deserves attention. Flow tables must drop freely through exactly 40mm vertical displacement. Worn hinges, damaged striking plates, or accumulated concrete residue alter dropping behavior. Monthly calibration checks using standard weights and precision measuring equipment maintain accuracy. The tamping rod must remain straight—bent rods invalidate tests but often go unnoticed until producing nonsensical data.

Sample representativeness affects results profoundly. Sampling from truck discharge doesn’t capture concrete pumped to the 40th floor after traveling 200 meters of pipeline. Testing must occur at the point of placement—or immediately after transport—to reflect actual placement conditions. Mobile flow test equipment allows on-site verification at various project locations.

Quality Control and Compliance Standards

Testing frequency varies by project criticality and concrete volume. Typical specifications mandate one flow test per 50 cubic meters for routine work. Critical applications—pile caps, shear walls, post-tensioned slabs—justify testing every 25 cubic meters or even every truckload. National Construction Authority regulations require documented quality control for all projects exceeding certain thresholds.

Certified materials testing laboratories throughout Kenya provide independent verification services. Organizations accredited under ISO/IEC 17025 standards offer defensible quality data for dispute resolution or structural audits. Major suppliers like Bamburi Cement, Athi River Mining, and Mombasa Cement maintain in-house laboratories certified by the Kenya Bureau of Standards.

Record keeping forms the backbone of effective quality control. Each flow test generates data requiring documentation: date, time, ambient temperature, concrete temperature, flow value, visual observations, technician identity, and sample location. Digital data management systems replace paper logbooks on sophisticated projects, enabling real-time quality monitoring and automated compliance reporting.

Acceptance Criteria and Rejection Protocols

Specification limits define acceptable flow ranges. A typical specification might state: “Flow shall be 450mm ± 50mm when tested per BS 1881:105:1984 within 30 minutes of batching.” Concrete producing 520mm flow passes; 560mm flow requires investigation; 600mm flow triggers rejection.

Rejection carries significant consequences. The concrete truck returns to the plant for remix or disposal—lost time, wasted materials, schedule delays. Clear acceptance criteria prevent disputes. Marginal results (e.g., 545mm against a 500mm ± 40mm specification) benefit from retesting rather than automatic rejection.

Remedial measures sometimes salvage questionable loads. Concrete with insufficient flow can receive superplasticizer addition at the jobsite—if specifications allow and proper batching equipment is available. Excessively fluid concrete might benefit from additional cement or extended mixing, though this compromises strength calculations. Most professionals prefer rejecting questionable loads over accepting marginal concrete that might compromise structural integrity.

Modern Advances in Concrete Workability Testing

Automated testing equipment enters Kenya’s construction market gradually. Digital flow meters using computer vision and image processing calculate spread diameter automatically. Sensors monitor drop height and count jolting cycles. Data uploads directly to cloud-based quality management systems, eliminating transcription errors while providing instant compliance verification.

The technology costs significantly more than manual equipment. A traditional flow table might cost $800; automated systems start around $8,000. Large batch plants and major contractors justify the investment through labor savings and improved data quality. Smaller operations continue relying on manual testing—a situation unlikely to change until equipment costs decline or regulatory pressure intensifies.

3D-printed concrete presents unique workability challenges. These emerging construction technologies require extremely tight rheological windows—fluid enough to pump and extrude yet stiff enough to maintain shape immediately after deposition. Traditional flow testing provides limited insight for these specialized applications. New test methods measuring yield stress, plastic viscosity, and structural breakdown characterize printable concrete more effectively.

Sustainable Concrete and Flow Testing Adaptations

Green concrete formulations incorporating recycled aggregates, supplementary cementitious materials, or alternative binding systems behave differently than conventional portland cement concrete. Flow characteristics change—sometimes unpredictably. Quality control protocols must adapt, establishing baseline flow ranges for each innovative formulation.

Kenya’s growing emphasis on sustainability drives increased use of supplementary materials. Fly ash from thermal power plants, ground granulated blast furnace slag from steel production, and locally-produced pozzolans reduce cement content while maintaining performance. These materials often enhance flow characteristics, allowing higher workability at lower water contents. Flow testing verifies these benefits quantitatively.

Carbon-negative concrete incorporating biochar or other novel materials requires comprehensive testing programs establishing flow characteristics across dosage ranges. Without historical data, engineers must develop performance envelopes through systematic testing. Flow test data forms part of this characterization, supplemented by strength testing, durability assessment, and long-term monitoring.

Frequently Asked Questions

What's the ideal flow value for pumped concrete?

Ideal flow values depend on pumping parameters—distance, vertical lift, pipeline diameter, and placement method. Generally, 450-550mm works for most applications. Longer pumping distances (over 300 meters) or high vertical lifts (above 100 meters) might require 500-600mm flow. Consulting with pumping contractors and ready-mix suppliers helps establish project-specific targets. Over-specifying flow increases segregation risks and costs.

Can flow test replace slump test entirely for my project?

Not universally. Flow testing targets high-workability concrete (collapse slump). Medium workability mixes (75-150mm slump) don't spread adequately for meaningful flow measurements. Use slump testing for conventional concrete, flow or slump flow testing for highly workable mixes. Many specifications require both—slump testing for initial batches establishing baseline, flow testing for production once high workability is confirmed.

How does aggregate type affect flow test results in Kenya?

Kenya's diverse geology produces varied aggregates with different flow characteristics. Coastal coral aggregates—angular and highly porous—absorb significant water, reducing effective W/C and decreasing flow. Volcanic rocks from Rift Valley quarries offer better shape and lower absorption. River gravels provide rounded shapes improving flow but may lack sufficient surface texture for optimal paste bonding. Each aggregate type requires calibrated mix designs.

Why do my flow test results vary between morning and afternoon batches?

Temperature effects likely explain the variation. Morning concrete produced in cool conditions maintains workability longer. Afternoon batches mixed during peak heat experience accelerated hydration, losing flow faster. Material temperature matters too—aggregates heated by sun exposure warm the mix. Consider scheduling critical pours during cooler periods or incorporating retarding admixtures for afternoon batches.

What flow value indicates the concrete is too fluid?

Excessive flow manifests through segregation signs rather than absolute values. BS standards suggest 600mm maximum; IS standards allow up to 150% increase (625mm for 250mm base molds). Beyond these limits, segregation becomes increasingly likely. Visual assessment supplements numerical limits—if aggregate piles centrally with mortar halos, the mix is too fluid regardless of measured flow value.

How often should flow tables be calibrated?

Monthly calibration checks maintain accuracy for active testing equipment. Measure actual drop height using precision instruments—it must equal 40 ± 1mm. Check table levelness, hinge operation, and striking plate condition. Annual certification by accredited calibration laboratories satisfies most quality management systems. Equipment showing damage or producing inconsistent results requires immediate recalibration or replacement.

Can I add water to concrete that fails flow test?

Adding water increases flow but compromises strength, durability, and specification compliance. Most codes prohibit water addition after initial mixing unless explicitly allowed by specifications. If flow proves inadequate, superplasticizer addition offers a better solution—when permitted and properly batched. Rejecting non-compliant loads protects structural integrity despite short-term inconvenience.

What's the relationship between flow and concrete strength?

No direct relationship exists—high flow doesn't automatically mean low strength. Properly designed high-flow concrete using superplasticizers and optimized aggregate grading achieves excellent strength. The key lies in W/C ratio control. Flow achieved through excessive water reduces strength; flow from superplasticizers at low W/C maintains or enhances strength.

How does humidity affect flow test results?

Humidity influences evaporation rates from fresh concrete surfaces. Low humidity accelerates surface drying, potentially creating crusts that restrict flow. High humidity slows drying, maintaining surface moisture. Effects are subtle for indoor testing but significant for outdoor work in Kenya's varied climate zones. Conducting tests in controlled environments minimizes humidity effects.

What flow value works best for self-compacting concrete?

SCC typically requires 550-750mm slump flow. The exact target depends on application—thin sections and congested reinforcement need higher flow (650-750mm). Thick sections with moderate reinforcement work at 550-650mm. Supplement flow testing with L-box, J-ring, or V-funnel tests for comprehensive SCC characterization. Never rely solely on flow measurements for SCC qualification.

author-avatar

About Eng. Evans Owiti

Eng. Evans Owiti is a seasoned Civil Engineer with over five years of experience in Kenya's construction industry. He is passionate about knowledge sharing and regularly contributes insights about engineering practices and industry developments through his writing.

Leave a Reply

Your email address will not be published. Required fields are marked *