
Grading Test: The Complete Guide to Sieve Analysis
Grading test, also known as sieve analysis or particle size distribution, determines the particle size distribution of construction materials through a systematic process that can make or break your project's structural integrity. Picture this: a contractor in Nairobi discovers after construction that their concrete lacks adequate strength. The culprit? Poorly graded aggregate that wasn't tested properly. This scenario plays out more often than you'd think across Kenya's construction sites.
Every cubic meter of concrete, every kilometer of road, and every foundation laid depends on understanding how particles in your materials are distributed. Whether you're a civil engineering student at the University of Nairobi, a site engineer in Mombasa, or a materials testing technician in Kisumu, mastering sieve analysis isn't optional—it's fundamental to delivering quality construction work.
What is Grading Test (Sieve Analysis)?
Sieve analysis assesses the particle size distribution of granular materials by passing them through progressively smaller sieves and weighing what each sieve retains. Think of it as sorting your materials by size, but with scientific precision that reveals hidden characteristics affecting performance.
The test works on a simple principle: different-sized particles separate when passed through wire mesh screens with specific opening dimensions. Materials move progressively down through stacked sieves arranged from largest to smallest openings, with particles catching on appropriately sized screens. What remains on each sieve tells a story about your material’s composition.
Understanding Particle Size Distribution
Particle size distribution isn’t just academic terminology—it’s the DNA of your construction materials. When you know how many particles fall into each size category, you can predict how your material will behave under stress, how much water it’ll absorb, and whether it’ll compact properly.
The distribution of grain sizes affects engineering properties like concrete strength, hardening time, and overall composite material performance. For instance, concrete made with all same-sized aggregate particles won’t achieve the density needed for structural applications. You need variety—large particles providing bulk, medium ones filling gaps, and fine particles cementing everything together.
In Kenya’s construction sector, this matters tremendously. Our diverse soil types from the volcanic soils of Central Kenya to the coral-based aggregates along the coast each present unique gradation challenges. Research on Nairobi County sand samples found that 67% fell within Zone II geological grading, indicating normal sand suitable for construction.
Why Sieve Analysis Matters in Kenya’s Construction Sector
The Kenya Bureau of Standards (KEBS) doesn’t require sieve analysis on a whim. KEBS testing laboratories specialize in assessing building products for strength, serviceability, and durability according to established standards. This regulatory framework protects consumers and ensures construction quality across the country.
Consider the financial implications. Using poorly graded aggregate increases cement consumption, raises costs, and still delivers inferior concrete. A study on sand sieving technologies in Kenya showed that efficient screening machines could reduce labor costs by 66%, saving Ksh 39,600 monthly. That’s money directly impacting your project’s bottom line.
Quality control through proper gradation testing prevents catastrophic failures too. We’ve seen buildings collapse, roads deteriorate prematurely, and foundations settle unevenly—often traced back to inadequate material testing. The tests required for high-rise building construction in Kenya include sieve analysis as a non-negotiable component precisely because particle distribution affects every structural element.
Related Question: Does aggregate gradation affect concrete workability?
Absolutely. Well-graded aggregate with appropriate particle distribution improves concrete workability significantly. When you have the right mix of particle sizes, the concrete flows better during placement, requires less water, and achieves higher strength. Conversely, uniform-sized particles create harsh mixes that are difficult to work with and don’t compact properly between reinforcement bars.
Types of Sieving Methods
Not all materials respond to the same testing approach. The sieving method you choose depends on your material’s physical properties and the accuracy level required.
Dry Sieving Method
Dry sieving suits cohesionless materials that don’t stick together when dry. This includes most sands, crushed stone, and clean aggregates common in Kenyan construction sites.
The process begins with oven-dried samples. You’ll heat your material at 105-110°C until achieving constant weight—this removes moisture that could affect results. Once cooled, you arrange sieves in descending order of opening size, pour your sample into the top sieve, and shake for 10-15 minutes.
Here’s what makes dry sieving practical: it’s faster than wet sieving, requires less preparation, and works perfectly for ready-mix concrete suppliers in Kenyan major cities who need quick quality checks on incoming aggregates.
However, dry sieving has limitations. Fine particles below 75 microns (0.075mm) tend to clump together through electrostatic forces, making complete separation difficult. Clay particles particularly problematic—they form aggregations that won’t break apart through shaking alone.
Wet Sieving Method
Wet sieving solves the problems dry sieving creates with cohesive materials. When dealing with soils containing silt or clay, or materials where fines must be accurately measured, wet sieving provides superior results.
The technique involves washing your sample over a 0.075mm sieve before regular sieving begins. Water disperses fine particles that would otherwise stick together, ensuring accurate measurement of material finer than 75 microns. This pre-wash removes clay coatings from larger particles and separates materials that dry methods miss.
After washing, you dry the retained material thoroughly (minimum 12 hours in the oven) before proceeding with normal sieving. This extra step takes more time and requires additional equipment, but the accuracy gained justifies the effort for critical applications like foundation design for different Kenyan soils.
The washed material also reveals the true percentage of fines in your sample—information crucial for predicting soil behavior, estimating cement requirements, and assessing aggregate cleanliness.
Related Question: Which sieving method is best for Kenyan soils?
For typical Kenyan soils, especially those in Nairobi, Kiambu, and Central Kenya with significant clay content, wet sieving delivers more reliable results. Studies on Nairobi County sands showed that proper sieving with moisture consideration significantly affected testing outcomes and sand classification. The black cotton soils prevalent in these regions particularly benefit from wet sieving because dry methods fail to separate clay particles effectively.
Coastal regions using coral-based aggregates or areas with predominantly sandy soils might manage with dry sieving, provided materials are genuinely clean and cohesionless. When in doubt, start with wet sieving—the extra time invested prevents costly mistakes from inaccurate gradation data.
Essential Equipment and Tools
Accurate sieve analysis demands proper equipment maintained to exacting standards. Let’s explore what you’ll need and where to source it in Kenya.
Sieve Sets and Specifications
Test sieves form the backbone of gradation analysis. These aren’t ordinary kitchen strainers—they’re precision instruments manufactured to tight tolerances. Each sieve consists of woven wire cloth with square openings mounted in a circular brass or stainless steel frame.
American standard sieves conforming to ASTM E11 have nominal apertures ranging from 20 micrometers to 200 millimeters, typically available in 8-inch (203mm) or 12-inch (305mm) diameter sizes. In Kenya, you’ll commonly encounter IS (Indian Standard) sieves alongside ASTM sieves, both acceptable for construction material testing.
Standard sieve sizes for coarse aggregate testing include 40mm, 20mm, 12.5mm, 10mm, 4.75mm, and 2.36mm. Fine aggregate testing uses 10mm, 4.75mm, 2.36mm, 1.18mm, 600 microns, 300 microns, 150 microns, and 75 microns sieves. Each sieve must be clearly marked with its aperture size and conform to recognized standards.
KEBS Civil Engineering Laboratory uses up-to-date national, regional (EAS) and international (EN, ISO) standards when analyzing construction products. Your sieves should match these standards to ensure test result acceptance by regulatory bodies.
Sieve maintenance matters more than most realize. Clean sieves after every use—particles stuck in openings alter the effective aperture size and skew results. Use coarse wire brushes for sieves down to No. 50 (300μm), and soft cloth or hair brushes for finer sieves to avoid damaging delicate wire mesh.
Regular calibration through certified materials testing laboratories ensures your sieves maintain accuracy. Worn or damaged sieves with distorted openings must be replaced—there’s no acceptable tolerance for equipment that compromises test integrity.
Supporting Equipment
Beyond sieves, you’ll need:
Mechanical sieve shakers automate the shaking process, delivering consistent results that manual shaking can’t match. Modern electromagnetic shakers use spring-mass systems with digitally controlled amplitude and timing. For laboratories testing multiple samples daily, this equipment pays for itself through time savings and result reproducibility.
Laboratory ovens capable of maintaining 105-110°C temperatures are non-negotiable. Sample drying must remove all moisture without damaging aggregate particles. Standard hot-air circulation ovens sold by laboratory equipment suppliers in Nairobi’s Industrial Area work perfectly.
Precision balances reading to 0.1 gram accuracy (or better) ensure weight measurements meet standard requirements. Final sieve retention weights should total within 0.3% of original sample weight—impossible to verify without accurate scales.
Riffle boxes or sample splitters divide large material quantities into representative smaller samples. These devices contain alternating slots that split material into two equal portions, eliminating human bias in sample selection.
Additional items include sample pans, brushes for sieve cleaning, drying trays, and protective equipment (gloves, dust masks) for operator safety during handling of dusty materials.
Related Question: Where can you calibrate testing equipment in Kenya?
KEBS operates ISO/IEC 17025:2017 accredited testing laboratories with headquarters in Nairobi on Popo Road, off Mombasa Road. They provide calibration services for testing equipment ensuring traceability to international standards. Additionally, Kenya Accreditation Service (KENAS) maintains lists of accredited calibration laboratories throughout the country.
For specialized equipment, some construction firms contract with international calibration services or purchase pre-calibrated equipment with valid certification. The key is maintaining a calibration schedule—typically annually for frequently-used equipment—and keeping documentation for regulatory inspections.

Sample Preparation Techniques
Garbage in, garbage out. Your test results are only as good as your sample preparation. Two primary methods ensure you’re testing representative material portions.
Quartering Method Explained
Quartering divides large material quantities through a systematic splitting process that maintains the original particle distribution. Here’s how it works in practice:
Start with your bulk sample spread in a circular pile. Using a straight edge or shovel, divide the pile into four approximately equal quarters. Select two opposite quarters (say, northeast and southwest portions) and combine them. Discard or return the other two quarters to the stockpile.
Mix the combined portion thoroughly and repeat the division process. Keep quartering until you reach the required test sample size—typically 1 kilogram for fine aggregate or 5-10 kilograms for coarse aggregate depending on maximum particle size.
The beauty of quartering lies in its simplicity and low equipment requirements. Any construction site can implement this method with minimal tools. However, it requires careful execution. Careless division that doesn’t maintain equal portions introduces bias. Wind can blow away fine particles during outdoor quartering, particularly problematic in Kenya’s dusty conditions.
For best results, quarter materials indoors or in calm conditions. Work on a clean, flat surface (a large tarpaulin works well). Take your time—rushing this step to “save” five minutes can invalidate hours of subsequent testing.
Riffling Method
Riffling uses a sample splitter (riffle box) containing alternating chutes that divide falling material into two equal streams. The device looks like a box with a series of vertical dividers creating channels—odd-numbered channels direct material to one container, even channels to another.
Pour your sample steadily into the riffle box hopper. Material splits automatically as it falls through the channels, creating two portions with identical gradation characteristics (in theory). Select one portion and return the other. Repeat until achieving desired sample size.
Riffling offers advantages over quartering: faster processing, more consistent splits, and reduced operator error. Research on sand screening in Kenya highlighted the importance of proper sample division for accurate testing outcomes. Laboratories processing numerous samples daily find rifflers indispensable.
The downside? Riffle boxes cost more than the negligible expense of quartering tools. They also require periodic cleaning and inspection to ensure channels haven’t become blocked or damaged. For maximum particle sizes exceeding the chute width, riffle boxes won’t work—you’ll need quartering instead.
Minimum Sample Sizes for Different Aggregates
Table 1: Minimum Sample Weights Required for Sieve Analysis
| Maximum Particle Size | Minimum Sample Weight (Coarse Aggregate) | Minimum Sample Weight (Fine Aggregate) |
|---|---|---|
| 10mm | 2 kg | 1 kg |
| 12.5mm | 5 kg | – |
| 20mm | 10 kg | – |
| 40mm | 20 kg | – |
| 63mm | 40 kg | – |
These minimums ensure statistical validity—too small a sample might not contain representative proportions of each particle size. Conversely, excessive sample sizes overload sieves and extend testing time unnecessarily.
Related Question: How do you obtain a representative sample for testing?
Representative sampling starts at the source. Don’t just grab material from the top of a stockpile—aggregates segregate during storage with finer particles settling and coarse particles rolling to the edges. Take multiple samples from different locations and depths within the stockpile, then combine them before quartering or riffling down to test size.
For delivered materials, sample from different truck loads or parts of the delivery. Mix these composite samples thoroughly before dividing. Document your sampling locations and methods—this information becomes crucial if test results are disputed or quality issues emerge later.
The effort invested in proper sampling pays dividends. Accurate samples mean reliable test results, which lead to appropriate material specifications and successful construction outcomes. Conversely, poor sampling practices waste everyone’s time producing meaningless data from unrepresentative material.
Grading Test Procedure - Dry Sieving
Let’s walk through the complete dry sieving procedure step-by-step, covering everything from sample prep to final calculations.
Step 1: Sample Collection and Initial Preparation
Obtain your representative sample using quartering or riffling as described above. Clean the sample if necessary to remove dirt, vegetation, or other foreign matter that isn’t part of the aggregate itself. Record any observations about the material’s condition.
Step 2: Oven Drying
Place your sample in a suitable container and dry it in an oven at 105-110°C. How long? Until the sample reaches constant weight—typically overnight for most aggregates. “Constant weight” means consecutive weighings one hour apart show no more than 0.1% difference.
Remove the sample from the oven and allow cooling to room temperature. This step matters. Weighing hot samples produces inaccurate results as heated air currents affect balance readings. Most laboratories place samples in a desiccator during cooling to prevent moisture reabsorption from humid air.
Step 3: Recording Initial Sample Weight (m1)
Once cooled, weigh your test sample accurately to 0.1 gram or better. Record this weight as m1—it forms the basis for all percentage calculations. Double-check your balance zero point before weighing.
Step 4: Sieve Arrangement
Stack your sieves with the largest opening sieve on top, progressively smaller sieves below, and a receiver pan at the bottom. Ensure each sieve fits snugly onto the one below—gaps allow material to escape and invalidate results.
Typical arrangements for coarse aggregate: 40mm, 20mm, 12.5mm, 10mm, 4.75mm, 2.36mm, pan. For fine aggregate: 10mm, 4.75mm, 2.36mm, 1.18mm, 600μm, 300μm, 150μm, 75μm, pan. Adjust based on your material’s expected gradation and specification requirements.
Clean all sieves before use. Even small amounts of material left from previous tests contaminate results. Inspect mesh for damage—torn or distorted openings require sieve replacement.
Step 5: Sieving Process
Pour your sample into the top sieve. If using mechanical shaking:
Place the lid on top and secure the entire nest in the shaker. Shake for 10-15 minutes, or until additional shaking produces no appreciable change in material retained on any sieve. Most modern shakers have timers and automatic shutoff.
For manual shaking (less common but sometimes necessary):
Hold the sieve nest firmly and shake with a back-and-forth motion, occasionally rotating and tapping. This technique requires skill and consistent effort. The rule of thumb: weigh retained material, shake for an additional minute, and weigh again; if the difference exceeds 1%, continue shaking.
Avoid overloading. Total material retained on any sieve at completion should not exceed one to two layers deep. Deeper accumulation prevents particles from reaching the mesh openings, blocking proper separation.
Step 6: Weight Measurement (m2)
After shaking, carefully separate each sieve without spilling material. Two weighing methods exist:
Cumulative method: Begin with the coarsest sieve. Pour retained material into a tared pan and weigh. Add the next finer sieve’s retained material to the same pan and weigh again. Continue adding each successive fraction. Calculate individual sieve retention by subtraction.
Individual method: Weigh material retained on each sieve separately. This approach takes more time but reduces error propagation and provides independent verification of each fraction.
Record weights to 0.1 gram. Weigh carefully—pouring material between containers risks spillage that affects accuracy.
Step 7: Verification
Add all retained weights plus material in the pan. This sum should equal your original sample weight (m1) within 0.3%. If the difference exceeds this, investigate: Was material lost during transfer? Did some escape around sieve edges? Are all sieves’ contents accounted for?
Significant weight discrepancies invalidate the test. Repeat using a fresh sample.
Step 8: Calculations
For each sieve, calculate:
Percentage Retained = (Weight retained on sieve / Total sample weight) × 100
Cumulative Percentage Retained = Sum of percentage retained on this sieve plus all coarser sieves
Percentage Passing = 100 – Cumulative Percentage Retained
These calculations reveal your material’s gradation. Plot percentage passing (y-axis) against sieve size (x-axis, logarithmic scale) to create the gradation curve—a visual representation showing if your material meets specification requirements.
Understanding the unit weight of materials in construction provides additional context for interpreting gradation results, as particle packing affects bulk density directly.
Related Question: How long should you shake sieves during testing?
Standard practice recommends 10-15 minutes of mechanical shaking for most aggregates, but this isn’t arbitrary. The goal is complete separation—all particles smaller than each sieve opening must pass through.
For fine, dusty materials, 10 minutes often suffices. Coarse aggregates with significant fines might require the full 15 minutes or slightly longer. The definitive test: shake for your standard duration, weigh retained material, shake one additional minute, reweigh; if percentage passing increases by more than 1%, keep shaking.
Material type affects shaking requirements too. Research on Kenyan sands found that moisture content significantly influenced screening time, with drier sand requiring less time than damp material. This explains why thorough oven drying before testing matters beyond just weight accuracy.
Never under-shake thinking you’ll save time. Incomplete separation produces false results showing more retained material (coarser gradation) than reality. This leads to incorrect concrete mix designs, improper soil classifications, or failed material specifications—consequences far costlier than a few extra minutes of shaking.
Order Construction Materials From Us Today

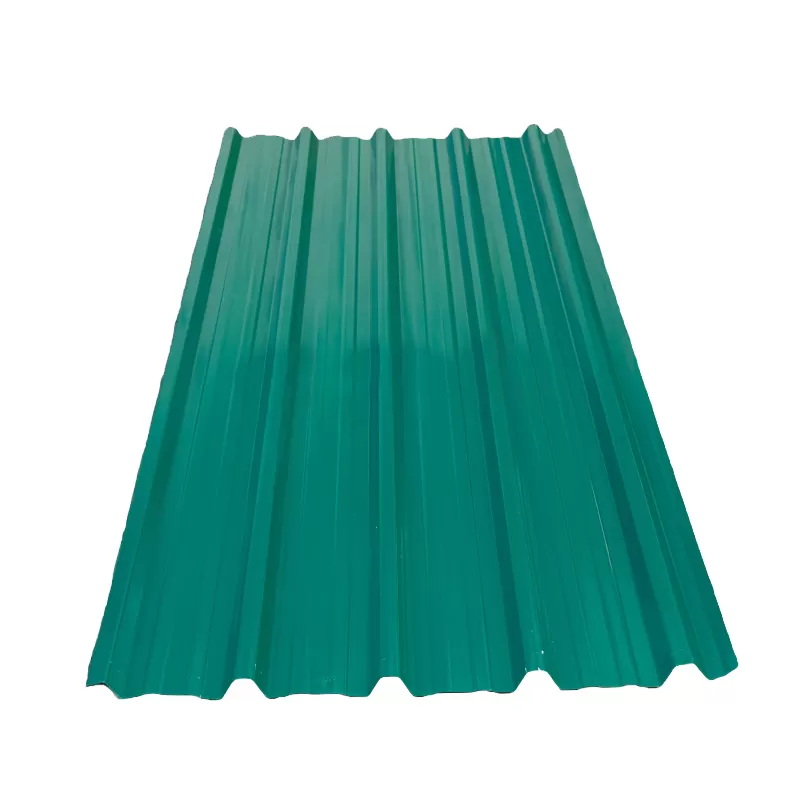
Box Profile (Glossy, Gauge 28)
KSh 650.00
Our Box Profile iron sheets are crafted for superior durability and exceptional weather resistance, making them the ideal choice for long-lasting roofing solutions across Kenya. To make your project even more convenient, we offer free delivery across Kenya when one orders 40 pieces and above. Trust us for reliable products and dependable service for all your building needs.
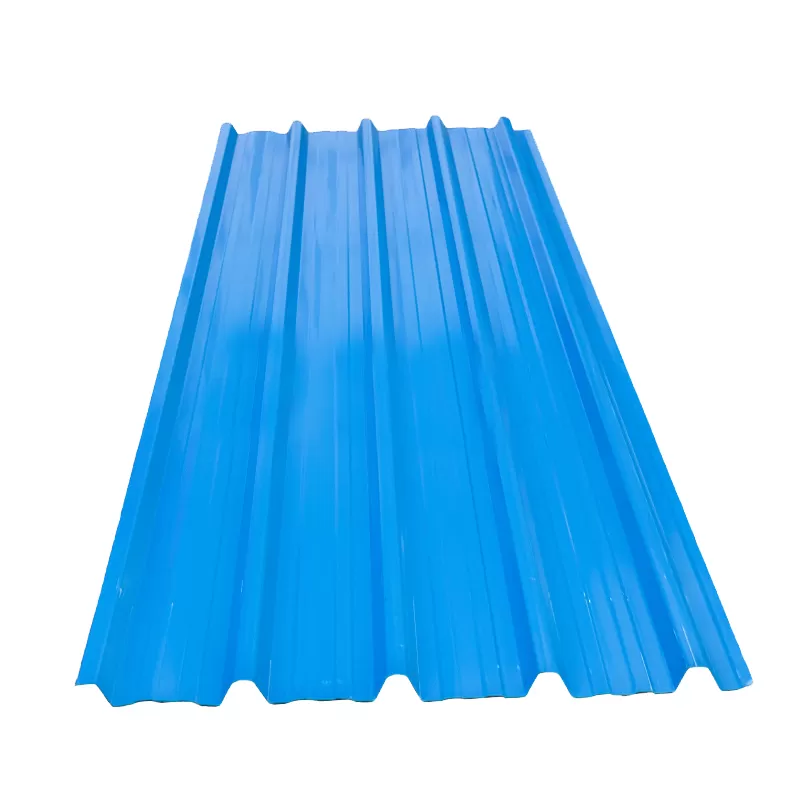
Box Profile (Glossy)
KSh 470.00
Our Box Profile iron sheets are crafted for superior durability and exceptional weather resistance, making them the ideal choice for long-lasting roofing solutions across Kenya. To make your project even more convenient, we offer free delivery across Kenya when one orders 40 pieces and above. Trust us for reliable products and dependable service for all your building needs.
Box Profile (Matte, Gauge 28)
KSh 680.00
Our Box Profile iron sheets are crafted for superior durability and exceptional weather resistance, making them the ideal choice for long-lasting roofing solutions across Kenya. To make your project even more convenient, we offer free delivery across Kenya when one orders 40 pieces and above. Trust us for reliable products and dependable service for all your building needs.
Box Profile (Matte)
KSh 530.00
Our Box Profile iron sheets are crafted for superior durability and exceptional weather resistance, making them the ideal choice for long-lasting roofing solutions across Kenya. To make your project even more convenient, we offer free delivery across Kenya when one orders 40 pieces and above. Trust us for reliable products and dependable service for all your building needs.


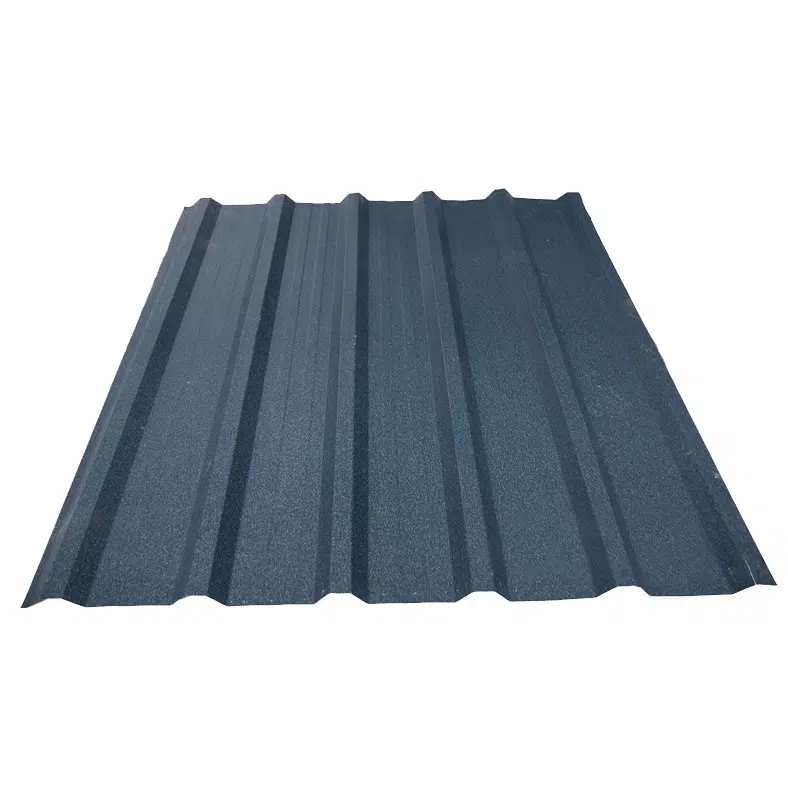
Corrugated Iron Sheet (Gauge 30)
KSh 470.00
Our corrugated iron sheets are crafted for superior durability and exceptional weather resistance, making them the ideal choice for long-lasting roofing solutions across Kenya. To make your project even more convenient, we offer free delivery across Kenya when one orders 40 pieces and above. Each high-quality sheet provides excellent value for money, ensuring your structure is protected for years to come. Trust us for reliable products and dependable service for all your building needs.


Elegantile (Glossy, Gauge 28)
KSh 670.00
Our Elegant Tile profile are crafted for superior durability and exceptional weather resistance, making them the ideal choice for long-lasting roofing solutions across Kenya. To make your project even more convenient, we offer free delivery across Kenya when one orders 40 pieces and above. Trust us for reliable products and dependable service for all your building needs.
Elegantile (Glossy, Gauge 30)
KSh 550.00
Our Elegant Tile profile are crafted for superior durability and exceptional weather resistance, making them the ideal choice for long-lasting roofing solutions across Kenya. To make your project even more convenient, we offer free delivery across Kenya when one orders 40 pieces and above. Trust us for reliable products and dependable service for all your building needs.


Elegantile (Matte, Gauge 28)
KSh 680.00
Our Elegant Tile profile with matte texture are crafted for superior durability and exceptional weather resistance, making them the ideal choice for long-lasting roofing solutions across Kenya. To make your project even more convenient, we offer free delivery across Kenya when one orders 40 pieces and above. Trust us for reliable products and dependable service for all your building needs.
Elegantile (Matte, Gauge 30)
KSh 580.00
Our Elegant Tile profile with matte texture are crafted for superior durability and exceptional weather resistance, making them the ideal choice for long-lasting roofing solutions across Kenya. To make your project even more convenient, we offer free delivery across Kenya when one orders 40 pieces and above. Trust us for reliable products and dependable service for all your building needs.
Versatile (Glossy, Gauge 28)
KSh 670.00
Our versatile iron sheets are crafted for superior durability and exceptional weather resistance, making them the ideal choice for long-lasting roofing solutions across Kenya. To make your project even more convenient, we offer free delivery across Kenya when one orders 40 pieces and above. Trust us for reliable products and dependable service for all your building needs.
Versatile (Glossy, Gauge 30)
KSh 550.00
Our versatile iron sheets are crafted for superior durability and exceptional weather resistance, making them the ideal choice for long-lasting roofing solutions across Kenya. To make your project even more convenient, we offer free delivery across Kenya when one orders 40 pieces and above. Trust us for reliable products and dependable service for all your building needs.

Versatile (Matte, Gauge 28)
KSh 680.00
Our versatile iron sheets are crafted for superior durability and exceptional weather resistance, making them the ideal choice for long-lasting roofing solutions across Kenya. To make your project even more convenient, we offer free delivery across Kenya when one orders 40 pieces and above. Trust us for reliable products and dependable service for all your building needs.
Grading Test Procedure - Wet Sieving
Wet sieving tackles the challenge that dry methods struggle with—materials containing significant clay or silt fractions. Let’s walk through the complete wet sieving procedure.
Step 1: Initial Sample Preparation
Begin by obtaining your representative sample through quartering or riffling. Record the sample’s initial condition—is it moist, contains visible clay, or has particles coated with fines? These observations help interpret final results.
Step 2: First Oven Drying
Place the sample in a suitable container and dry at 105-110°C until reaching constant weight. This typically takes overnight for most soil samples. The drying removes natural moisture that would interfere with subsequent washing and weight measurements.
Cool the sample to room temperature. Weight measurements must be taken on cooled samples to ensure accurate readings unaffected by thermal air currents. Record this initial dry weight as m1.
Step 3: Pre-Washing Process
This step separates wet sieving from dry sieving. Place a 0.075mm sieve in your washing setup. To protect the delicate 0.075mm wire cloth from damage, stack a coarser sieve (1.18mm or 2.36mm) on top. The protective sieve catches larger particles while allowing smaller material to reach the fine sieve.
Pour your sample onto the top sieve. Using a gentle stream of clean water, wash the material thoroughly. Continue washing until water running through the 0.075mm sieve runs clear, indicating removal of all material finer than 75 microns. This process disperses clay particles and separates them from coarser fractions.
The washing technique matters. Too vigorous a spray can damage the sieve mesh or force particles through openings they shouldn’t pass. Too gentle washing leaves clay coatings on larger particles, defeating the purpose. Find the middle ground—steady water flow that keeps material agitated without applying excessive pressure.
Step 4: Second Oven Drying
Transfer all washed material retained on both sieves to a suitable pan. Return this washed sample to the oven for at least 12 hours at 105-110°C. Extended drying time ensures complete moisture removal from clay-coated particles, which hold water more tenaciously than clean sand or gravel.
Allow cooling to room temperature before proceeding. The weight difference between your original sample (m1) and the washed-dried sample tells you precisely how much material finer than 0.075mm existed in your original material—critical information for soil classification and concrete mix design.
Step 5 through Step 8
Follow the same procedures as dry sieving: arrange sieves, pour sample, shake thoroughly, weigh retained material on each sieve, verify total weights, and perform calculations. The key difference? Your calculations now account for the pre-washed fines.
Percentage passing 0.075mm sieve = [(m1 – washed sample weight) / m1] × 100
This value gets added to your calculations for the pan material, giving you the complete gradation picture including the finest particles.
Related Question: Why is washing necessary for cohesive soils?
Clay particles develop electrostatic bonds with water molecules and larger particles, creating aggregations that won’t separate through mechanical shaking alone. When you try dry sieving on clay-containing soil, these aggregations behave like larger particles, getting retained on sieves they should pass through.
The washing process breaks these bonds. Water acts as both a dispersing agent and transport medium. As clay particles separate from larger grains, flowing water carries them through the sieve openings. Without washing, you’d underestimate the fine fraction dramatically—possibly classifying a clayey sand as clean sand, with severe consequences for foundation design or concrete mix proportioning.
In Kenya’s construction environment, where black cotton soils dominate many regions, wet sieving becomes essential rather than optional. The Proctor test similarly deals with these problematic soils, requiring careful material characterization.
Understanding Test Results
Raw sieve data means little until you transform it into meaningful information. Let’s explore how to calculate, plot, and interpret gradation results.
Calculating Percentage Retained
For each sieve, you’ve recorded the weight of material retained. Converting these weights to percentages provides standardized values comparable across different sample sizes.
Percentage Retained on Individual Sieve = (Weight retained on sieve / Total sample weight) × 100
Example: If your 2.36mm sieve retained 85 grams from a 1000-gram sample: Percentage retained = (85 / 1000) × 100 = 8.5%
Calculate this for every sieve in your nest. These individual percentages show the proportion of your sample falling within each size range.
Cumulative Percentage Calculations
Cumulative percentage retained tracks how much material is coarser than each sieve size. Starting from the coarsest sieve, add each sieve’s individual percentage to all previous percentages.
Example calculation:
- 10mm sieve retained: 12%
- 4.75mm sieve retained: 18%
- 2.36mm sieve retained: 8.5%
Cumulative percentage retained:
- On 10mm: 12%
- On 4.75mm: 12% + 18% = 30%
- On 2.36mm: 30% + 8.5% = 38.5%
Percentage passing tells you how much material is finer than each sieve size:
Percentage Passing = 100 – Cumulative Percentage Retained
Continuing the example:
- Passing 10mm: 100 – 12 = 88%
- Passing 4.75mm: 100 – 30 = 70%
- Passing 2.36mm: 100 – 38.5 = 61.5%
Percentage passing values typically appear in specifications. When a specification says “passing 4.75mm sieve: 95-100%,” it’s requiring that 95-100% of the material be smaller than 4.75mm.
Creating Grading Curves
The grading curve or particle size distribution curve visualizes your material’s gradation. Plot sieve size (in millimeters) on the x-axis using a logarithmic scale, and percentage passing on the y-axis using an arithmetic scale.
The S-curve generated from sieve analysis provides logarithmic graphical representation showing cumulative percent passing of particles against sieve opening sizes. This curve shape tells experienced engineers volumes about material behavior before running a single additional test.
Why logarithmic scale for sieve size? Because sieve sizes follow a geometric progression. Logarithmic plotting spaces them evenly despite the wide range from 0.075mm to 40mm or larger.
Mark each sieve size on the x-axis and plot its corresponding percentage passing on the y-axis. Connect the points with a smooth curve. The resulting shape reveals your material’s gradation type.
Interpreting Gradation Types
Well-graded soils have curves extending across a wide range of particle sizes with no gaps, indicating good representation of all sizes from coarse to fine. These materials compact efficiently, achieve high density, and provide excellent engineering properties. The curve has a gentle, S-shaped slope.
Poorly-graded (uniformly-graded) soils show steep curves over a narrow particle size range, indicating most particles are similar size. Beach sand exemplifies this—mostly uniform particles with few coarse or fine fractions. These materials drain well but don’t compact effectively.
Gap-graded materials have curves showing sudden jumps, indicating missing particle sizes within the distribution. The curve might extend across a wide range overall, but specific intermediate sizes are absent or deficient. This creates instability—smaller particles can migrate through voids between larger ones.
In Kenya’s construction practice, specifications often reference grading zones. Fine aggregate (sand) typically falls into Zone I (coarsest), Zone II (medium), Zone III (finer), or Zone IV (finest). Studies on Nairobi County found most construction sand falls within Zone II, considered ideal for general concrete work.
Related Question: What does a steep grading curve indicate?
A steep curve spanning a short horizontal distance indicates uniform gradation—most particles fall within a narrow size range. This creates specific properties: excellent drainage (beneficial for filter applications), poor compaction (problematic for structural fills), and harsh concrete mixes requiring excess water.
Steep curves appear when examining beach sand, wind-blown desert sand, or crusher fines from a single crushing stage. Conversely, gentle curves spanning wide horizontal distances indicate well-graded materials with particles distributed across many size ranges—the preferred condition for most construction applications.
Key Parameters and Coefficients
Beyond visual curve interpretation, engineers calculate numerical coefficients describing gradation quantitatively. These parameters support classification systems and predict material behavior.
Coefficient of Uniformity (Cu)
Coefficient of uniformity is the ratio of D60 to D10, mathematically expressed as Cu = D60/D10. Here’s what those D-values mean:
D10 (Effective Size): The particle diameter at which 10% of the material is finer. Read from your grading curve by finding 10% on the y-axis, moving horizontally to intersect the curve, then dropping vertically to read the size on the x-axis.
D60: The particle diameter at which 60% of material is finer. Determine using the same curve-reading process.
Cu values greater than 4 to 6 classify soil as well-graded, while Cu less than 4 indicates poorly-graded or uniformly-graded soil. Uniformly graded soil has nearly identical particles with Cu approximately equal to 1.
Why these specific values? Higher Cu values indicate soil mass consists of particles with different size ranges, creating better interlocking and denser packing. For construction applications like the California Bearing Ratio test, well-graded materials perform superior to uniform materials.
Coefficient of Curvature (Cc)
Cu alone doesn’t tell the complete story. A material might have distant D60 and D10 values producing high Cu, yet still miss complete ranges of grain sizes—characteristic of gap-graded materials. The coefficient of curvature addresses this limitation.
Coefficient of curvature is calculated as Cc = (D30)² / (D10 × D60), where D30 is the particle size at which 30% of material is finer.
For well-graded soil, Cc must range between 1 and 3. Values outside this range indicate poor gradation even if Cu suggests otherwise. Cc less than 1 indicates poorly graded soil, while values greater than 3 also suggest poorly graded conditions affecting compaction and strength.
Fineness Modulus
Fineness modulus is an empirical value describing the average size of particles in aggregate samples, providing a basis to select estimated proportions for concrete mix design. Unlike Cu and Cc which apply to soils, fineness modulus primarily characterizes concrete aggregates.
Calculate fineness modulus by adding cumulative percentages retained on each standard sieve, then dividing the sum by 100. Standard sieves for fine aggregate include 150μm, 300μm, 600μm, 1.18mm, 2.36mm, 4.75mm, 9.5mm, and larger sizes following a 2:1 ratio.
Fineness modulus for fine aggregate typically ranges from 2.2 to 3.2, with fine sand at 2.2-2.6, medium sand at 2.6-2.9, and coarse sand at 2.9-3.2. A typical fineness modulus for fine aggregate used in concrete is between 2.70 and 3.00.
Duff Abrams, the American materials researcher who developed the slump test, defined fineness modulus in 1918 stating that aggregate of the same fineness modulus will require the same quantity of water to produce mix of the same consistency. This principle still guides concrete mix design today, particularly relevant when comparing materials from different quarries or assessing consistency of supply.
The concrete slump test works hand-in-hand with fineness modulus determination to ensure mix consistency and workability.
Effective Size (D10)
D10 represents effective particle size, meaning 10% of particles are finer and 90% are coarser than this dimension. This single value carries significant meaning for predicting soil behavior.
D10 influences permeability directly. Hazen’s empirical relationship for permeability uses D10 as the key parameter, with coefficient of permeability approximately proportional to D10 squared. Smaller D10 values indicate finer materials with lower permeability—crucial information for drainage design, filter layer specification, and foundation seepage calculations.
For filters protecting drain systems, D10 of the filter material must relate to D85 of the protected soil through specific ratios. These relationships prevent fine soil particles from migrating through filter voids while maintaining adequate drainage capacity.
Table 2: Soil Classification Based on Gradation Coefficients
| Material Type | Cu Requirement | Cc Requirement | Description |
|---|---|---|---|
| Well-Graded Gravel (GW) | Cu ≥ 4 | 1 ≤ Cc ≤ 3 | Wide particle range, good compaction |
| Poorly-Graded Gravel (GP) | Cu < 4 or Cc outside range | – | Uniform size, poor compaction |
| Well-Graded Sand (SW) | Cu ≥ 6 | 1 ≤ Cc ≤ 3 | Wide particle range, good density |
| Poorly-Graded Sand (SP) | Cu < 6 or Cc outside range | – | Uniform size, good drainage |
| Gap-Graded Material | Cu may be high | Cc outside 1-3 range | Missing intermediate sizes |
Related Question: How do gradation coefficients affect construction suitability?
Well-graded soils compact better than poorly-graded soils, making them preferred for highway embankments, earthen dams, and structural fills. The particle size variety in well-graded materials allows smaller particles to fill voids between larger ones, achieving higher density and strength.
Poorly-graded soils provide better drainage than well-graded materials because more void spaces exist between uniform-sized particles. This makes them ideal for drainage layers behind retaining walls, under floor slabs, or around perforated drain pipes.
For Kenya’s infrastructure projects, understanding these relationships prevents costly mistakes. Using poorly-graded material where compaction matters (like road subgrade) leads to settlement and pavement failure. Conversely, using well-graded material in drainage applications reduces effectiveness and can cause waterlogging.
Material Testing Laboratories in Kenya
Quality sieve analysis requires proper facilities. Let’s explore testing laboratory options available across Kenya.
Kenya Bureau of Standards (KEBS) Facilities
KEBS operates ISO/IEC 17025:2017 accredited testing laboratories that have provided measurement solutions supporting standardization and conformity assessment since 1981. This accreditation signifies internationally recognized competence and adherence to the highest quality standards.
Headquarters Location: KEBS main testing facilities are located on Popo Road, off Mombasa Road in Nairobi. The Civil Engineering Laboratory here conducts comprehensive aggregate and soil testing including sieve analysis.
KEBS laboratories are accredited by the South African National Accreditation System (SANAS) for approximately 300 tests, with around 45 qualified staff serving as technical signatories. Accreditation covers various fields including civil engineering, with testing conforming to national (KS), regional (EAS), and international standards (EN, ISO, BS).
Regional Testing Centers: KEBS operates chemistry and microbiology testing laboratories in Mombasa (Coast Region), Kisumu (Lake Region), and Eldoret (North Rift Region). While these focus primarily on food and chemical testing, the headquarters Civil Engineering Laboratory handles most construction material testing.
Services Offered: The Civil Engineering Laboratory uses up-to-date national, regional, and international standards when analyzing construction products for strength, serviceability, and durability. This includes comprehensive aggregate testing, soil classification, concrete testing, and materials compliance verification.
Contact: info.testing@kebs.org or visit their Popo Road facility for testing inquiries and quotations.
Private Testing Laboratories
Beyond KEBS, several private laboratories provide materials testing services. The Kenya Accreditation Service (KENAS) maintains registries of accredited laboratories meeting ISO/IEC 17025 requirements.
When selecting private laboratories, verify:
- KENAS accreditation status: Only accredited labs meet international quality standards
- Scope of accreditation: Ensure sieve analysis specifically appears in their accredited test list
- Turnaround time: Some projects need faster results than government labs provide
- Geographic location: Transport costs and sample degradation during transit matter
- Experience with similar materials: Labs familiar with Kenyan soils and aggregates provide better service
Major construction firms and consulting engineers maintain lists of approved laboratories. The certified materials testing laboratories must meet strict quality management requirements.
Many universities with civil engineering programs operate testing laboratories, including University of Nairobi, Jomo Kenyatta University of Agriculture and Technology (JKUAT), and Technical University of Kenya. These facilities often accept commercial testing work alongside academic research.
Related Question: Which laboratories are KEBS-accredited for aggregate testing?
KEBS headquarters Civil Engineering Laboratory holds SANAS accreditation number T0718 covering mechanical and physical testing including aggregate characterization. This remains the primary government facility for construction materials testing in Kenya.
Private laboratories must obtain KENAS accreditation for their test results to carry regulatory weight. Check the KENAS website (https://kenas.go.ke) for current lists of accredited laboratories and their specific scopes. Accreditation status changes as laboratories gain or lose certification, so verify current standing before submitting samples.
For critical projects requiring regulatory approval—building permits, road construction contracts, or structural designs requiring National Construction Authority review—use accredited laboratories exclusively. The small cost difference pales compared to risks of having test results challenged or rejected.
Standards and Specifications
Sieve analysis procedures follow established standards ensuring result consistency and acceptance.
Kenyan Standards (KS)
Kenya Bureau of Standards publishes national standards governing construction materials testing. Key standards include:
KS 02-95: Specification for natural aggregates used in concrete, including grading requirements and testing procedures. This standard defines acceptable gradation zones for fine and coarse aggregates in Kenyan construction.
KS 1237: Test methods for aggregates, including detailed sieve analysis procedures aligned with international practice while accommodating local conditions.
These standards incorporate requirements from international standards while addressing Kenya-specific factors like available aggregate sources, climate considerations, and local construction practices. When specifications reference “KS standards,” these are the documents that apply.
International Standards (ASTM, BS, ISO)
KEBS employs standard methodologies from KS, EAS, ISO, EN, and BS when conducting tests. Understanding these international standards helps interpret test results and compare them with global practice:
ASTM C136: Standard test method for sieve analysis of fine and coarse aggregates. This American standard details procedures widely referenced in international construction specifications.
ASTM C117: Standard test method for materials finer than 75μm sieve in mineral aggregates by washing. This covers the wet sieving procedure specifically.
BS 812-103.1: Testing aggregates – Methods for determination of particle size distribution. The British Standard approach familiar to practitioners trained in Commonwealth systems.
ISO 17892-4: Geotechnical investigation and testing – Laboratory testing of soil – Part 4: Determination of particle size distribution. This international standard covers soil testing specifically.
Most Kenyan specifications accept test results following any of these standards, provided the laboratory holds appropriate accreditation. The principles remain consistent across standards—differences appear mainly in specific sieve sizes used and calculation methods.
Compliance Requirements
The National Construction Authority mandate proper materials testing and quality assurance. Projects must demonstrate compliance with specified standards through:
Material test certificates: Laboratories must provide formal reports on letterhead, signed by accredited personnel, showing complete test data and clear pass/fail statements against specifications.
Frequency requirements: Specifications typically require testing at intervals based on quantity supplied—perhaps one test per 100 cubic meters of concrete aggregate, or per 500 meters of road construction.
Traceability: Maintaining chain-of-custody documentation connecting test results to specific material batches and project locations ensures audit compliance.
Record retention: Keep all test certificates for the project duration plus specified warranty periods. Building permit authorities and future structural modifications may require accessing historical test data.
Common Errors and How to Avoid Them
Even experienced technicians make mistakes during sieve analysis. Recognizing common errors prevents wasted time and questionable results.
Sample Contamination: Using dirty sieves or contaminated work surfaces introduces foreign material that skews results. Always clean sieves thoroughly between tests. Work on clean surfaces. Inspect samples for obvious contamination before testing.
Inadequate Shaking Time: Rushing the shaking process leaves material on sieves that should have passed through. Continue shaking until additional shaking produces no appreciable change in retained material, verified by weighing after extended shaking periods. Mechanical shakers ensure consistency human shaking can’t match.
Sieve Overloading: Excess material on sieves prevents particles from reaching mesh openings, blocking proper separation. If material depth exceeds one or two particle layers at test completion, your sample was too large. Split it and test portions separately, combining results mathematically.
Calculation Mistakes: Transcription errors, decimal point mistakes, or formula errors plague manual calculations. Double-check all arithmetic. Have another person verify critical calculations. Use spreadsheet templates with built-in formulas to minimize human error.
Equipment Calibration Issues: Worn sieves with enlarged openings or damaged scales produce invalid results. Inspect sieves regularly for damage, replace worn units, and maintain regular calibration schedules for balances. Budget for periodic sieve replacement—they’re consumable items with finite service lives.
Incomplete Drying: Testing damp material produces artificially high weights and incorrect gradation. Ensure samples reach constant weight before testing. In humid environments, store dried samples in sealed containers until testing to prevent moisture reabsorption.
Ignoring Material Loss: Dropping particles during transfer, spillage during weighing, or dust loss during shaking all invalidate results. Work carefully. If total retained weight deviates more than 0.3% from initial sample weight, something went wrong—repeat the test.
Applications in Kenyan Construction
Understanding why we perform sieve analysis motivates careful execution. Let’s explore practical applications in Kenya’s construction sector.
Concrete Mix Design
Aggregate gradation drives concrete properties. The concrete mixing design require understanding how particle distribution affects workability, strength, and durability.
Fine aggregate grading affects concrete consistence and finishability, with fineness modulus supporting mix design optimization. Sand with appropriate gradation requires less cement paste to coat particles, reducing costs while maintaining or improving strength. Poorly graded sand increases water demand, cement consumption, and susceptibility to cracking.
Coarse aggregate gradation determines maximum packing density. Well-graded coarse aggregate from ready-mix concrete suppliers fills space efficiently, minimizing voids and reducing paste requirements. This translates to economy and durability.
For high-performance concrete in structures like the tall buildings in Kenya, precise gradation control becomes critical. Variations affecting workability or strength can compromise structural integrity.
Road Construction
In highway embankment and earthen dam design, soil gradation controls acceptability of materials, as well-graded soils compact more effectively than poorly-graded alternatives. The Kenya Road Design Manual 2025 specifies gradation requirements for each pavement layer.
Base and subbase materials require well-graded aggregates providing interlocking and load distribution. Gradation requirements must be met before soil used in projects is accepted for construction. Rejected materials cost money to remove and replace—preventing this through proper testing saves significantly.
Surface course aggregates need specific gradation producing durable, skid-resistant surfaces. Too many fines create slippery conditions when wet. Too few fines leave open texture vulnerable to water infiltration and freeze-thaw damage.
Filter layers in drainage systems protecting pavement structures require gradation matching specific criteria related to the soil being drained. Improper gradation allows fine soil particles to wash through, clogging drainage systems and causing pavement failure.
Soil Classification
Geotechnical investigations for foundation design require soil classification based partly on gradation. The Unified Soil Classification System (USCS) and AASHTO classification systems use gradation coefficients alongside plasticity characteristics to categorize soils.
Soil gradation affects engineering properties including compressibility, shear strength, and hydraulic conductivity—fundamental parameters for foundation design. The importance of geotechnical survey in any construction project stems partly from need to characterize soil gradation and related properties.
A geotechnical report specifying soil as “poorly-graded sand” versus “well-graded sand-gravel mixture” communicates volumes about expected behavior. Foundation type, allowable bearing capacity, and settlement predictions all flow from proper soil classification based on accurate sieve analysis.
Quality Assurance Programs
Construction quality control depends heavily on routine gradation testing. The required documentation of materials before starting construction projects in Kenya includes quality assurance plans specifying testing frequencies and acceptance criteria.
Supplier verification ensures quarries and concrete plants deliver materials meeting specifications. Random testing catches gradation drift before it affects construction quality. Documenting consistent compliance protects contractors from liability if problems emerge later.
Process control in concrete plants uses gradation testing to adjust mix proportions compensating for natural aggregate variation. Automated systems can adjust mixes daily based on incoming aggregate tests, maintaining consistent concrete quality despite source variations.
Frequently Asked Questions
How much sample do I need for sieve analysis?
Sample size depends on maximum particle size. For fine aggregate (passing 10mm), 1 kilogram suffices. For 20mm maximum size coarse aggregate, use at least 10 kilograms. Larger maximum sizes require proportionally larger samples—40mm aggregate needs 20kg minimum. Insufficient samples produce unrepresentative results.
Can I reuse the same sample for multiple tests?
Never reuse samples for sieve analysis. The testing process alters material through handling, potential particle breakage, and moisture changes. Each test requires a fresh, representative sample obtained from the bulk material following proper sampling procedures.
What causes test results to vary between laboratories?
Variation stems from several sources: differences in sieve condition (worn vs. new), shaking duration and intensity, sample handling causing breakage or loss, moisture content variations, and operator technique. Accredited laboratories minimize variation through standardized procedures, regular equipment calibration, and personnel training. Expect some variation—specifications typically allow tolerance ranges accounting for this.
How often should construction materials be tested?
Testing frequency depends on specification requirements, material source consistency, and project criticality. Typical frequencies: concrete aggregate testing once per 100-200 cubic meters, road base materials once per 500 meters or daily (whichever is more frequent), and structural fill every 500 cubic meters. Critical projects warrant more frequent testing.
What's the difference between sieve analysis and hydrometer analysis?
Sieve analysis characterizes particles larger than 0.075mm through mechanical separation. Hydrometer analysis measures particles finer than 0.075mm based on their settling velocity in water. Complete soil gradation often requires combining both methods—sieve analysis for coarse fractions, hydrometer for fine fractions.
Can aggregate gradation change during storage?
Yes, segregation occurs during storage and handling. Stockpiles segregate with finer particles settling and coarse particles rolling to edges Gilson Co.
Why do specifications have grading zones for sand?
Different sand gradations suit different applications. Zone I (coarsest) produces harsh concrete requiring more cement but offering good strength. Zone IV (finest) creates cohesive, easily-finished concrete but demands more water. Zone II and III offer balanced properties for general construction. Specifying zones ensures sand suits the intended application.
What happens if aggregate fails gradation requirements?
Several options exist: blend with other materials to achieve acceptable gradation, screen to remove excess fines or oversized particles, crush oversized material to smaller sizes, or reject and source alternative material. Economic considerations usually favor blending or processing over outright rejection.
Do I need wet or dry sieving for concrete aggregate?
Dry sieving typically suffices for clean concrete aggregate. However, if aggregates contain clay coatings (common with some Kenyan quarry products), wet sieving provides more accurate results. When doubt exists, wet sieving ensures accuracy despite extra time investment.
How do seasonal variations affect aggregate gradation?
Quarry operations vary seasonally. Rainy seasons may introduce more fines through washing, while dry seasons concentrate dust. Source material changes as quarries progress through geological strata. This necessitates regular testing rather than assuming gradation remains constant. Adjust mix designs promptly when test results show gradation shifts.
Lorem ipsum dolor sit amet, consectetur adipiscing elit. Ut elit tellus, luctus nec ullamcorper mattis, pulvinar dapibus leo.
")

 Test")
